We have many years experience building market leading predictive models utilising tabular, time series and image data.
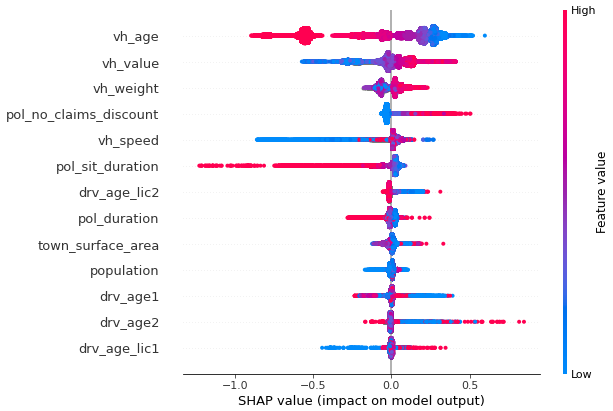
We have a strong understanding of a variety of methodologies including linear models, tree based models and deep learning. The problem, data available and client needs determine the appropriate techniques.
By taking a scientific approach we minimise the chance of overfitting to historic data and maximise the accuracy of the models on unseen data.
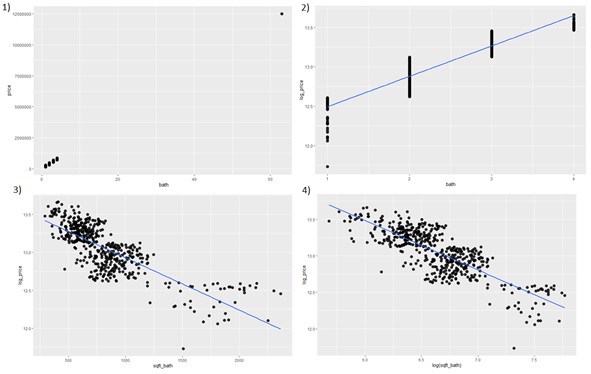
We explore your data thoroughly, ensuring the data is correct and clean. If required we will also transform the data to produce better model results.
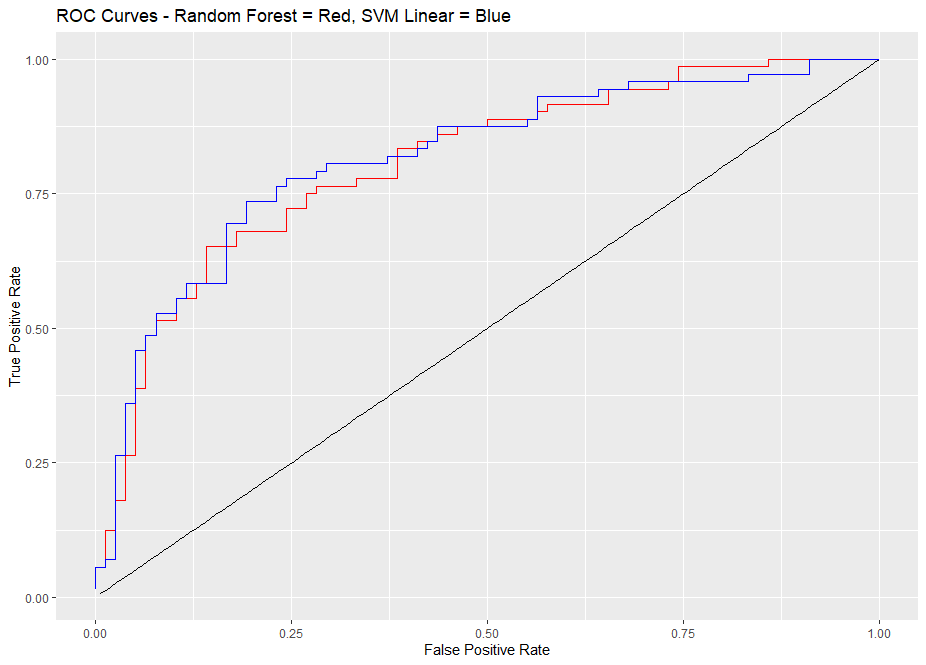
A portion of the data is set aside and used to assess the chosen model in order to better understand the expected performance
Utilising machine learning techniques, we can quickly identify which are the main factors that influence a target variable.
Examples include identifying key drivers behind customer lifetime value, house prices, insurance claims.
By building a predictive model, we takes into account all other factors and so we aren't just identifying correlation but the actual factor effects.
In this example of claim frequency, the algorithm has identified the factor 'vh_age' to be the most important factor
By plotting claim frequency by the 'vh_age' factor, we can see there is indeed a strong relationship here.
Often customers are segmented, either by characteristics or behaviour in order to deploy different strategies.
By building predictive models, we can cluster customers based on their predicted behaviours.
Using the predicted behaviour or cluster group, pricing/advertisting/other tools can be optimised in order to maximise business objectives.
An example of customers segemented by their predicted behaviour
Business objectives such as maximising revenue, profit, sales, can be optimised using the behavioural models.
Dashboards are useful for visualising data and important business metrics
This allows you to dive into the data and combine it with your domain experience.
We are experienced with a variety of dashboarding tools such as PowerBI, Tableau and Dash.
An example of a PowerBI dashboard
An example of a simple plotly/dash dashboard. This is created within a flask app, and then hosted utilising AWS Lambda services as a cheap method of deployment.
This can be viewed at solve-fx.com